IBM® i2® Analyst’s Notebook® offers a rich visual analysis environment designed to help analysts and their organizations turn large sets of disparate information into high-quality, actionable intelligence to help identify, predict and prevent criminal,
terrorist and fraudulent activities.
A flexible data acquisition approach allows analysts to more quickly collate both structured and unstructured information to help build a single, cohesive intelligence picture. The flexible data model and visualization environment coupled with a wide range of visual analysis tools help users build multiple views for detailed network, temporal, statistical, or geospatial analysis and reduce the time taken to identify key connections, networks, patterns and trends that may exist. The results gained from this detailed analysis can be shared via intuitive and visual briefing charts or visualizations that can be included in end intelligence products. These can simplify the communication of sometimes complex information and ultimately help to drive more timely and accurate operational decision making.
A technology road tested by over 2,500 organizations worldwide, Analyst’s Notebook is designed to help government agencies and private sector businesses in their fight against increasingly sophisticated criminal and terrorist organizations.
Functionality:
Flexible data acquisition
Data can be rapidly created in an Analyst’s Notebook chart via intuitive drag and drop functionality, the visual importer or from multiple databases with IBM’s automated data acquisition products. Charts can be quickly generated by dragging and dropping data in the form of entities, links and attributes onto the chart. Volume data can be imported from structured data files via the wizard-style Visual Importer which creates Import Specifications that can be saved to greatly reduce the time taken to import additional information into a chart.
Flexible data model
Analyst’s Notebook provides a flexible data model that does not constrain the input of complex relational data. The data visualization environment allows users to represent information in a variety of forms including link, network or timeline charts. Items can be represented as entities, links, events, timelines or attributes in order to best present the type of data and allow more effective analysis and visualization of a wide range of data sets including social networks, telephone records, financial transactions and internet traffic records to name but a few.
Powerful analytical capabilities
Analyst’s Notebook delivers a powerful range of analytical tools that can help analysts quickly convert large volumes of data into high value intelligence. The wide range of analytical tools can help analysts to quickly analyze large data sets by providing multiple analytical views including association, temporal, spatial, statistical and spreadsheet views.
Simple communication of complex data
Analyst’s Notebook provides the means to communicate complex data with intuitive and easy-to-follow briefing charts and reports that capture and organize supporting data for briefing and presentation purposes. Analyst’s Notebook charts can also be shared electronically to those without access to Analyst’s Notebook. IBM® i2® Chart Reader is available at no charge and provides read-only access to charts which can then be navigated, searched or printed. Rich information behind chart entities and links can also be searched and read.
Product Screenshots:
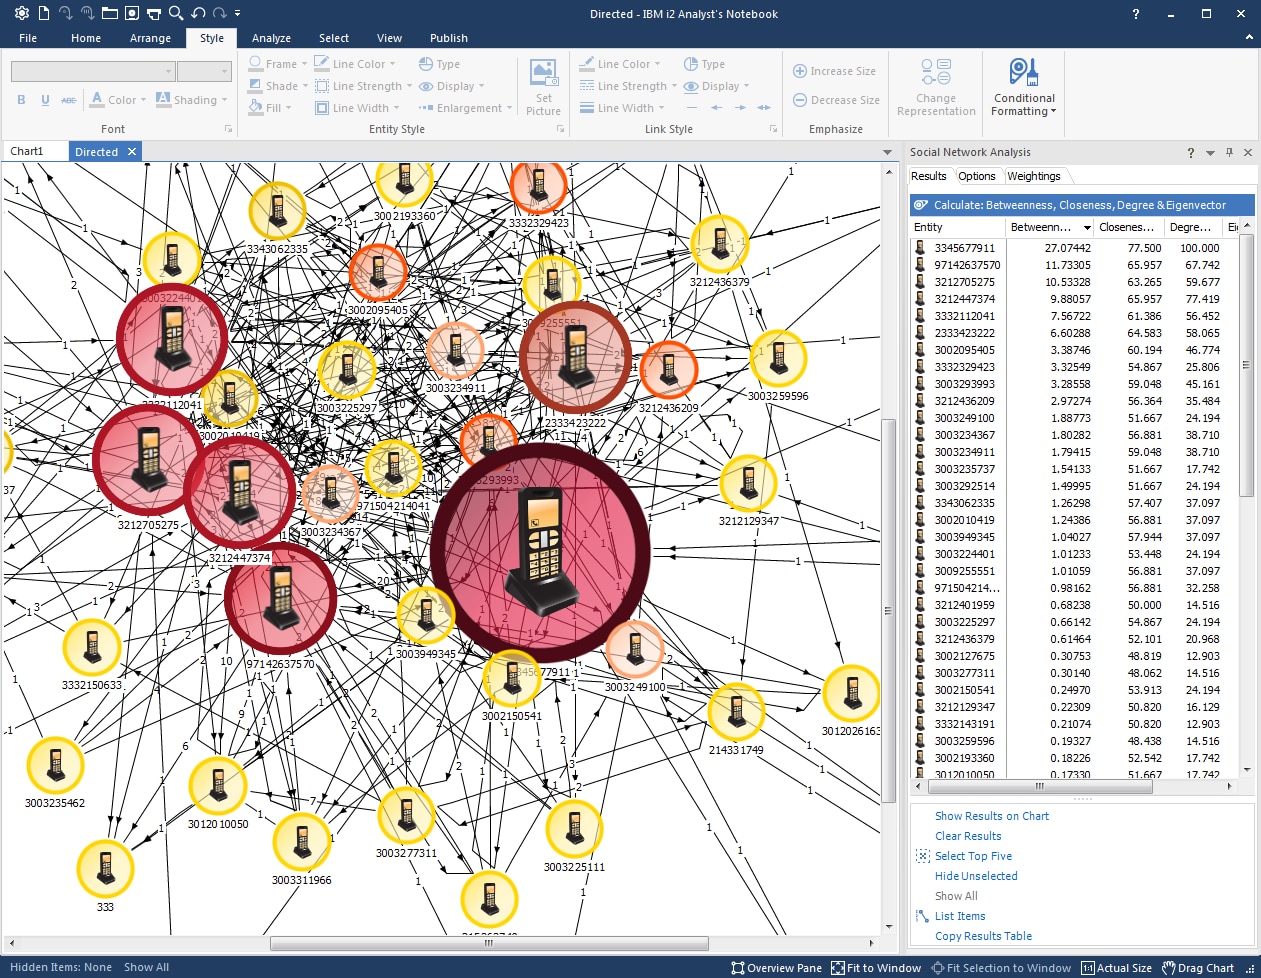
Social network analysis
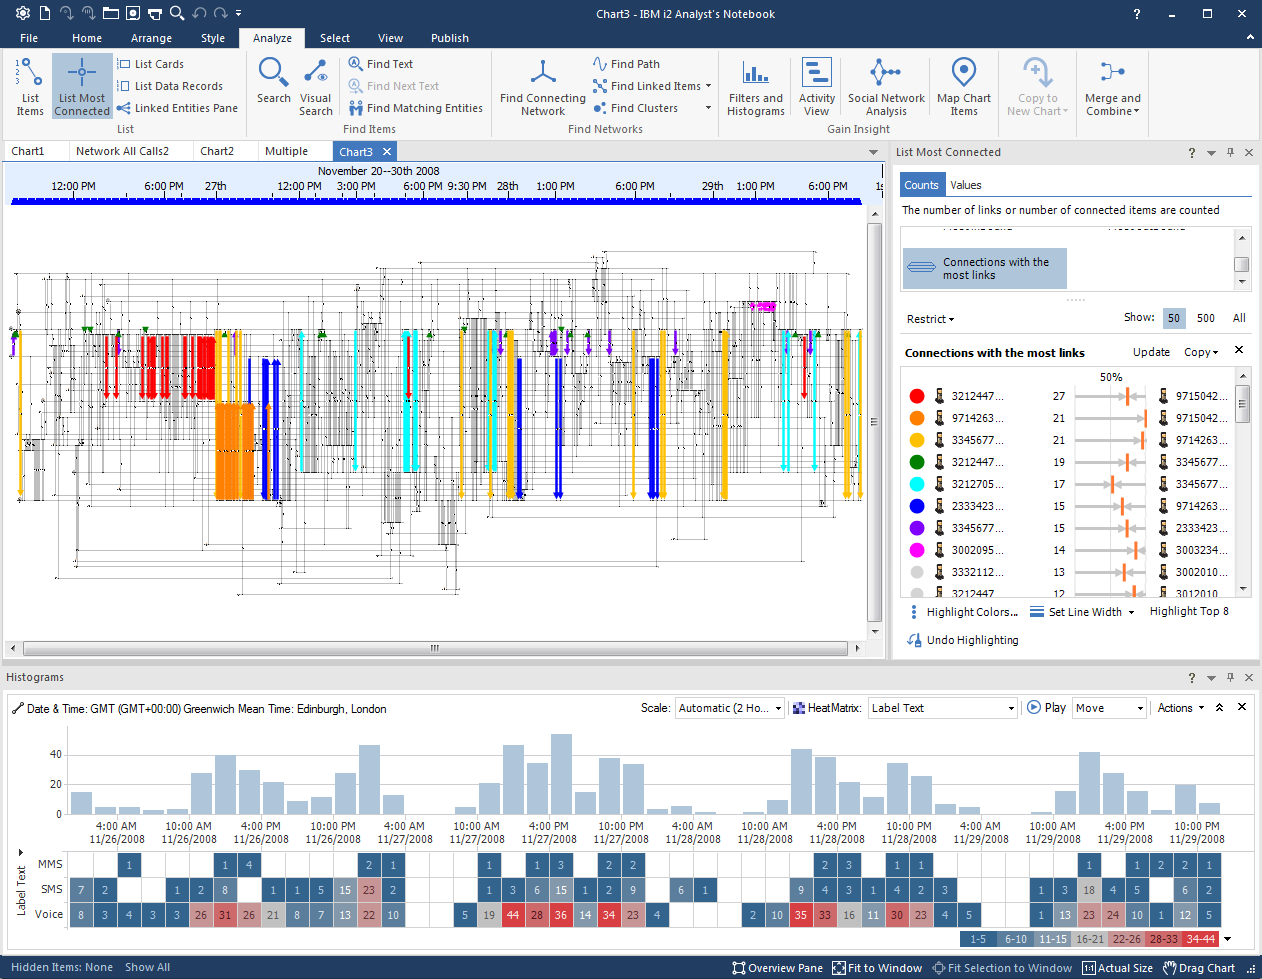
Find connected entities and networks
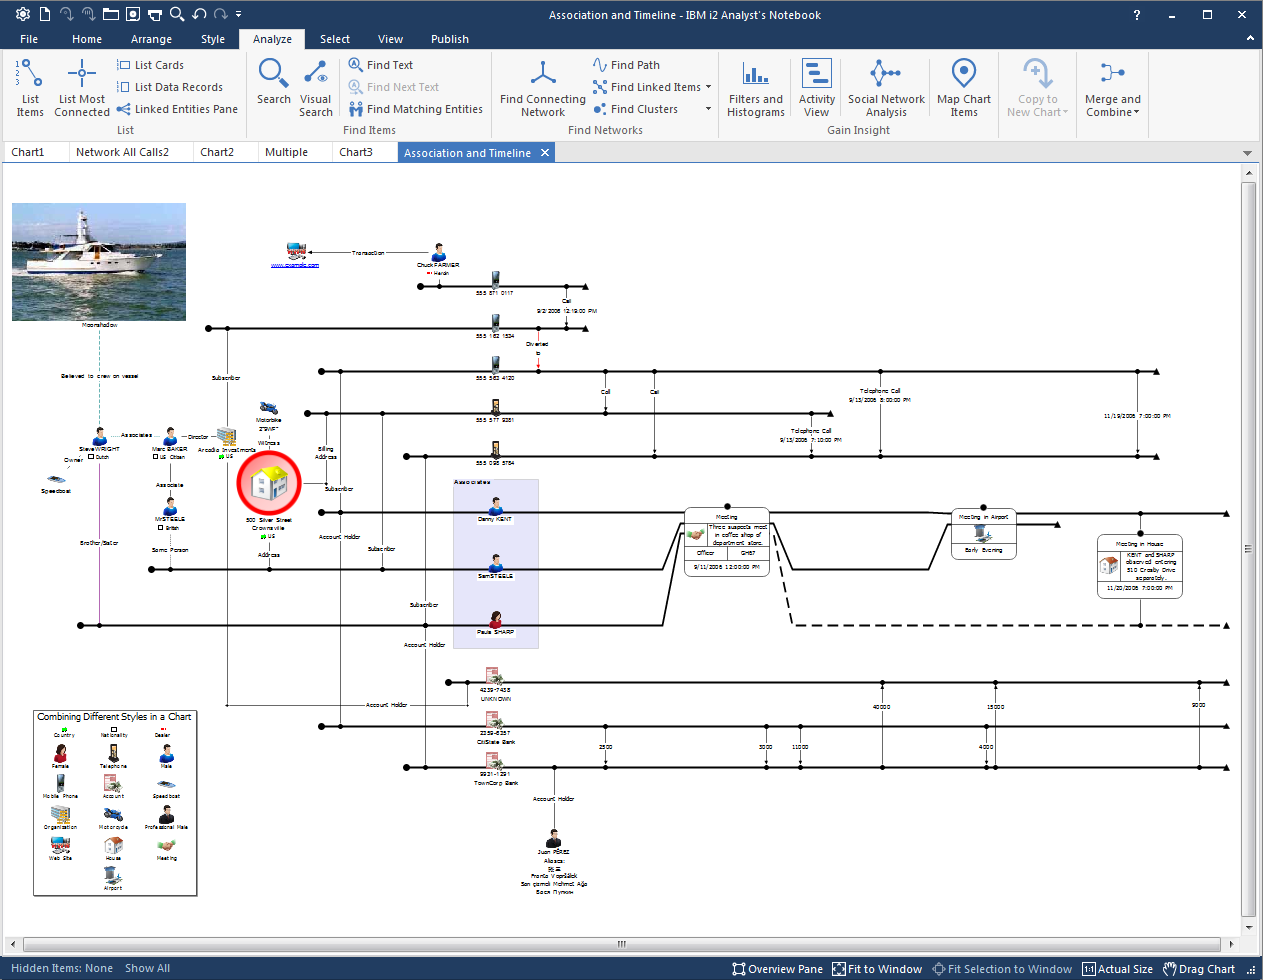
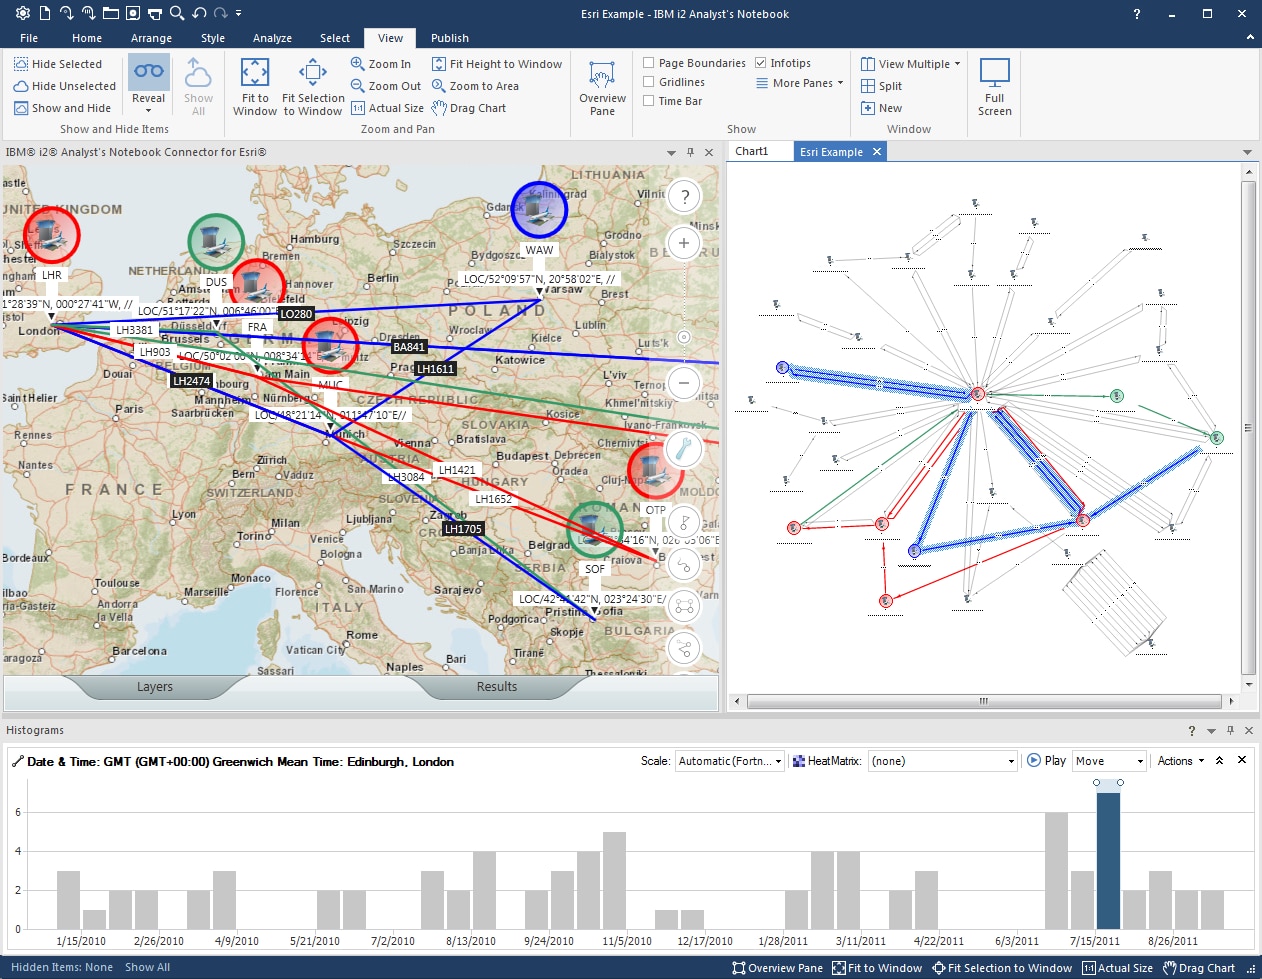
Temporal and geospatial views
Association and timeline views